Dominguez Channel Watershed
Upcoming Events
Quick Links
How much stormwater in our watershed do we need to manage?
Who We Are
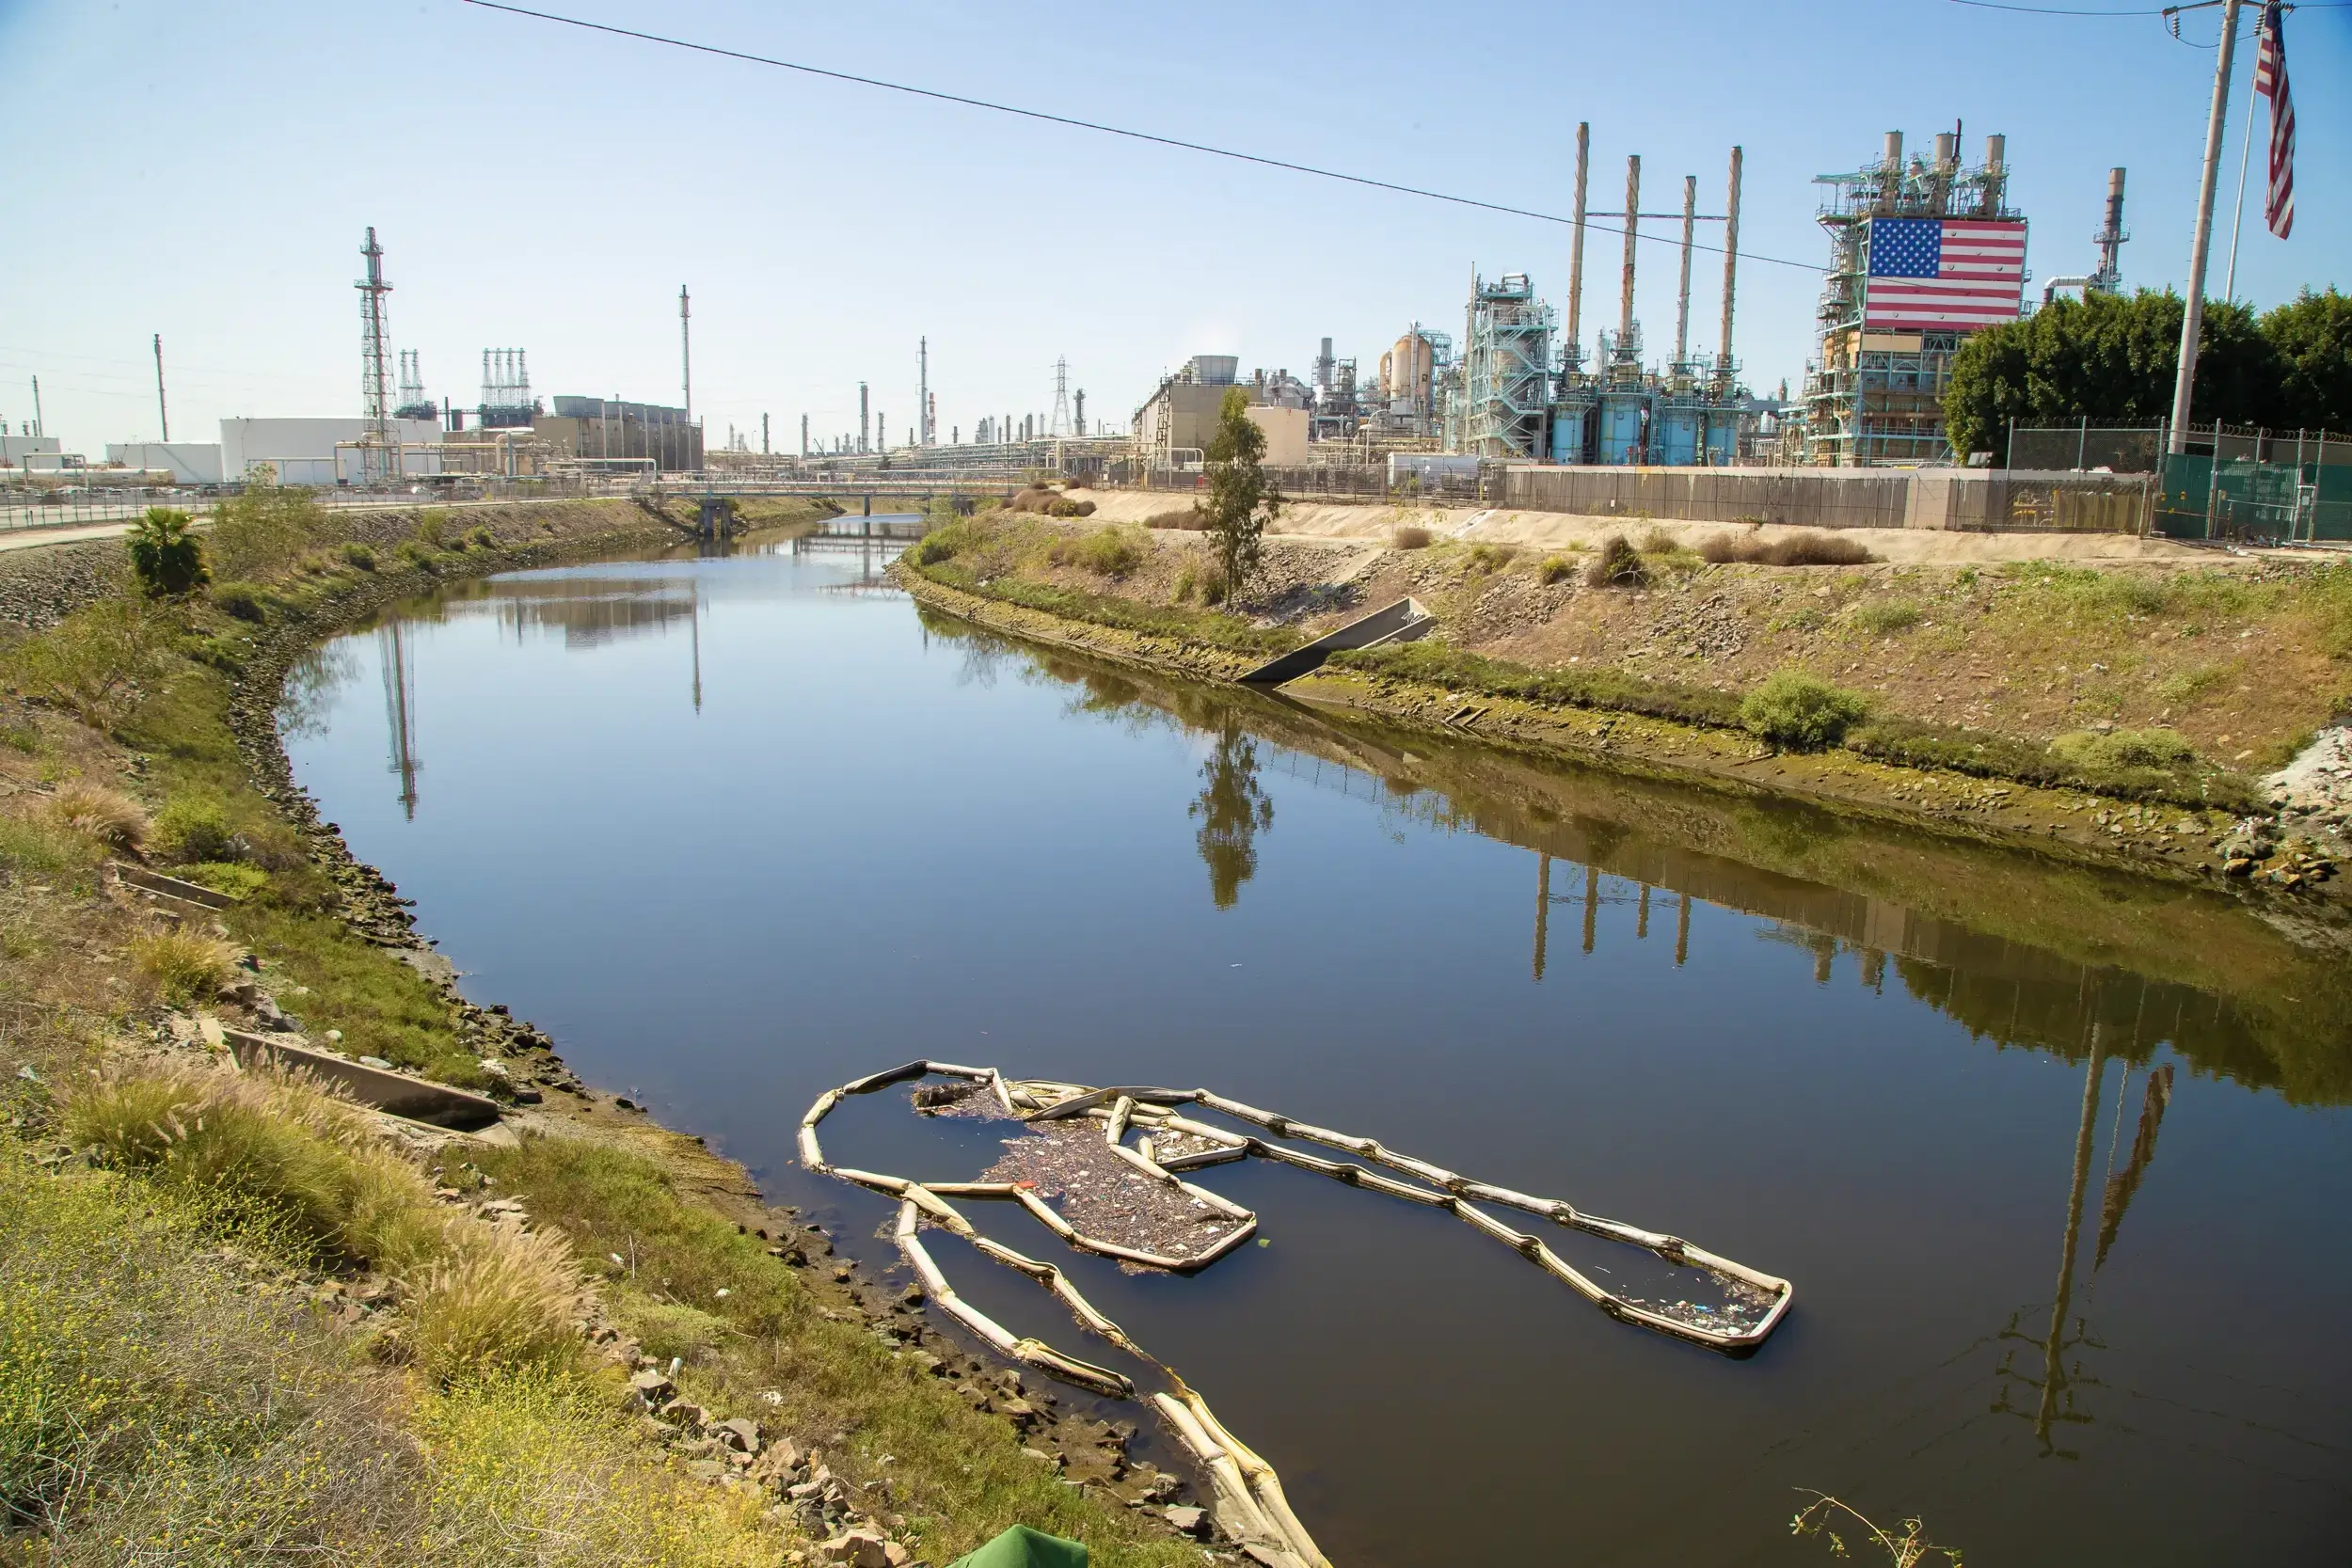
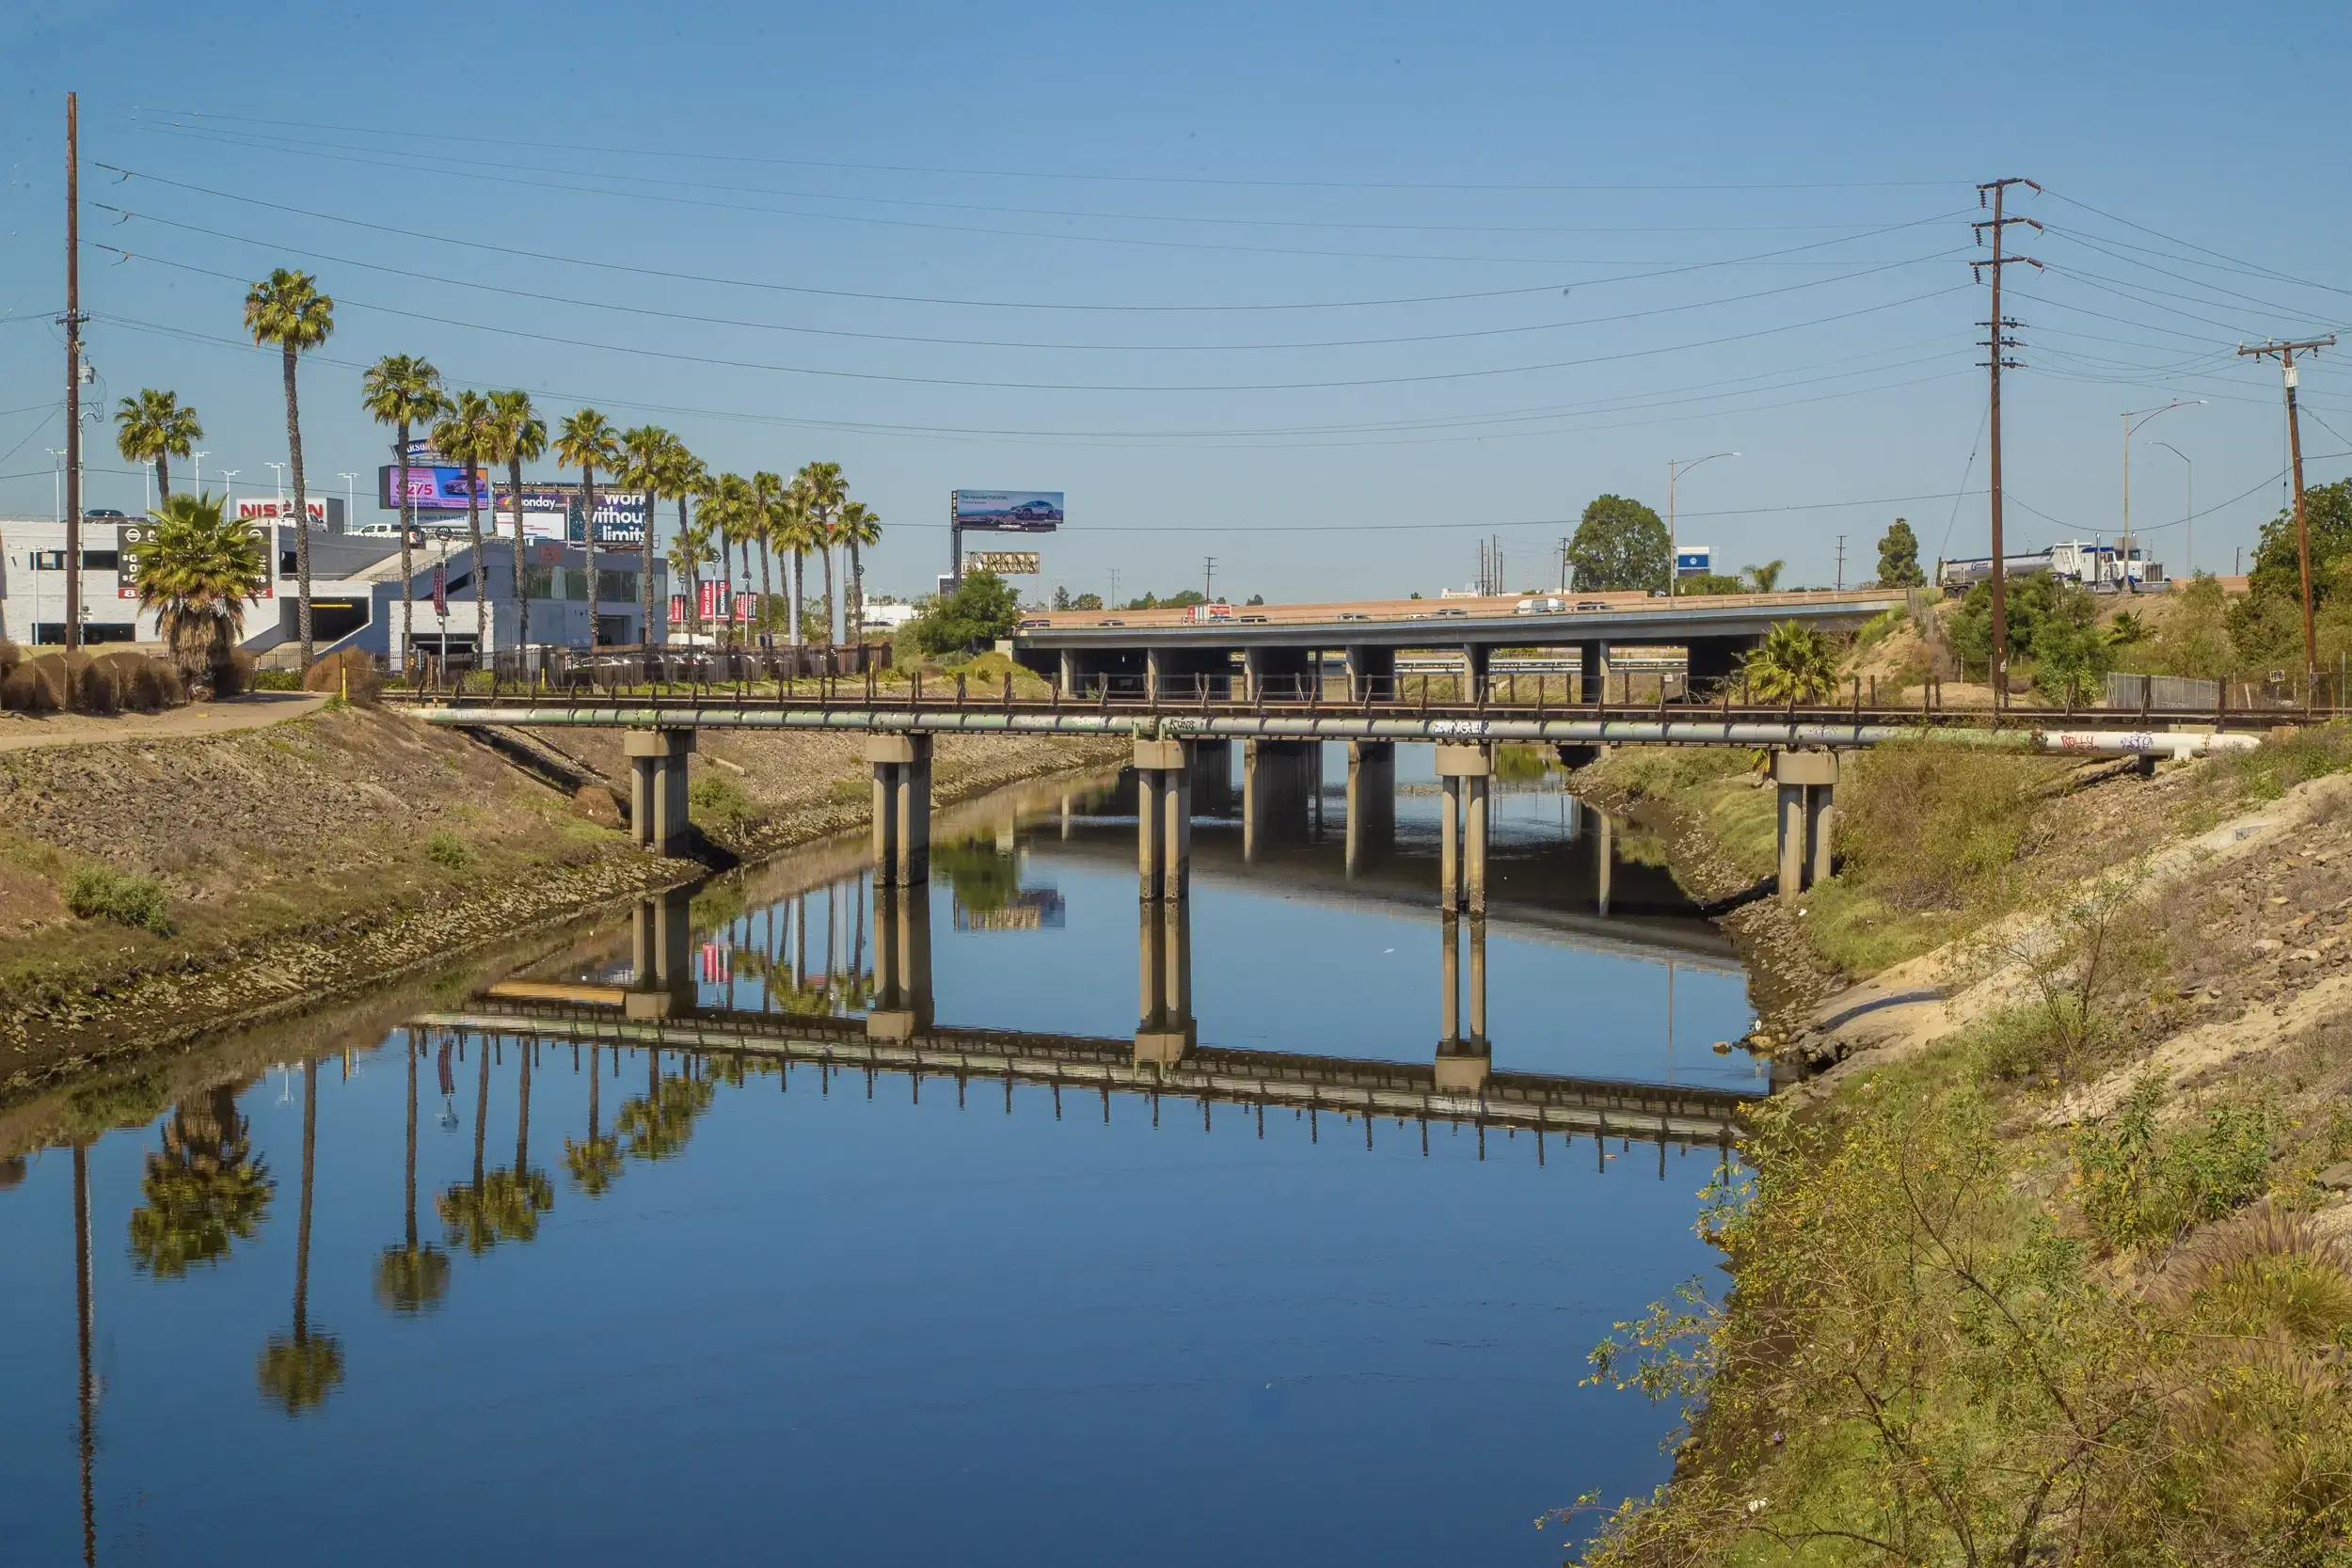
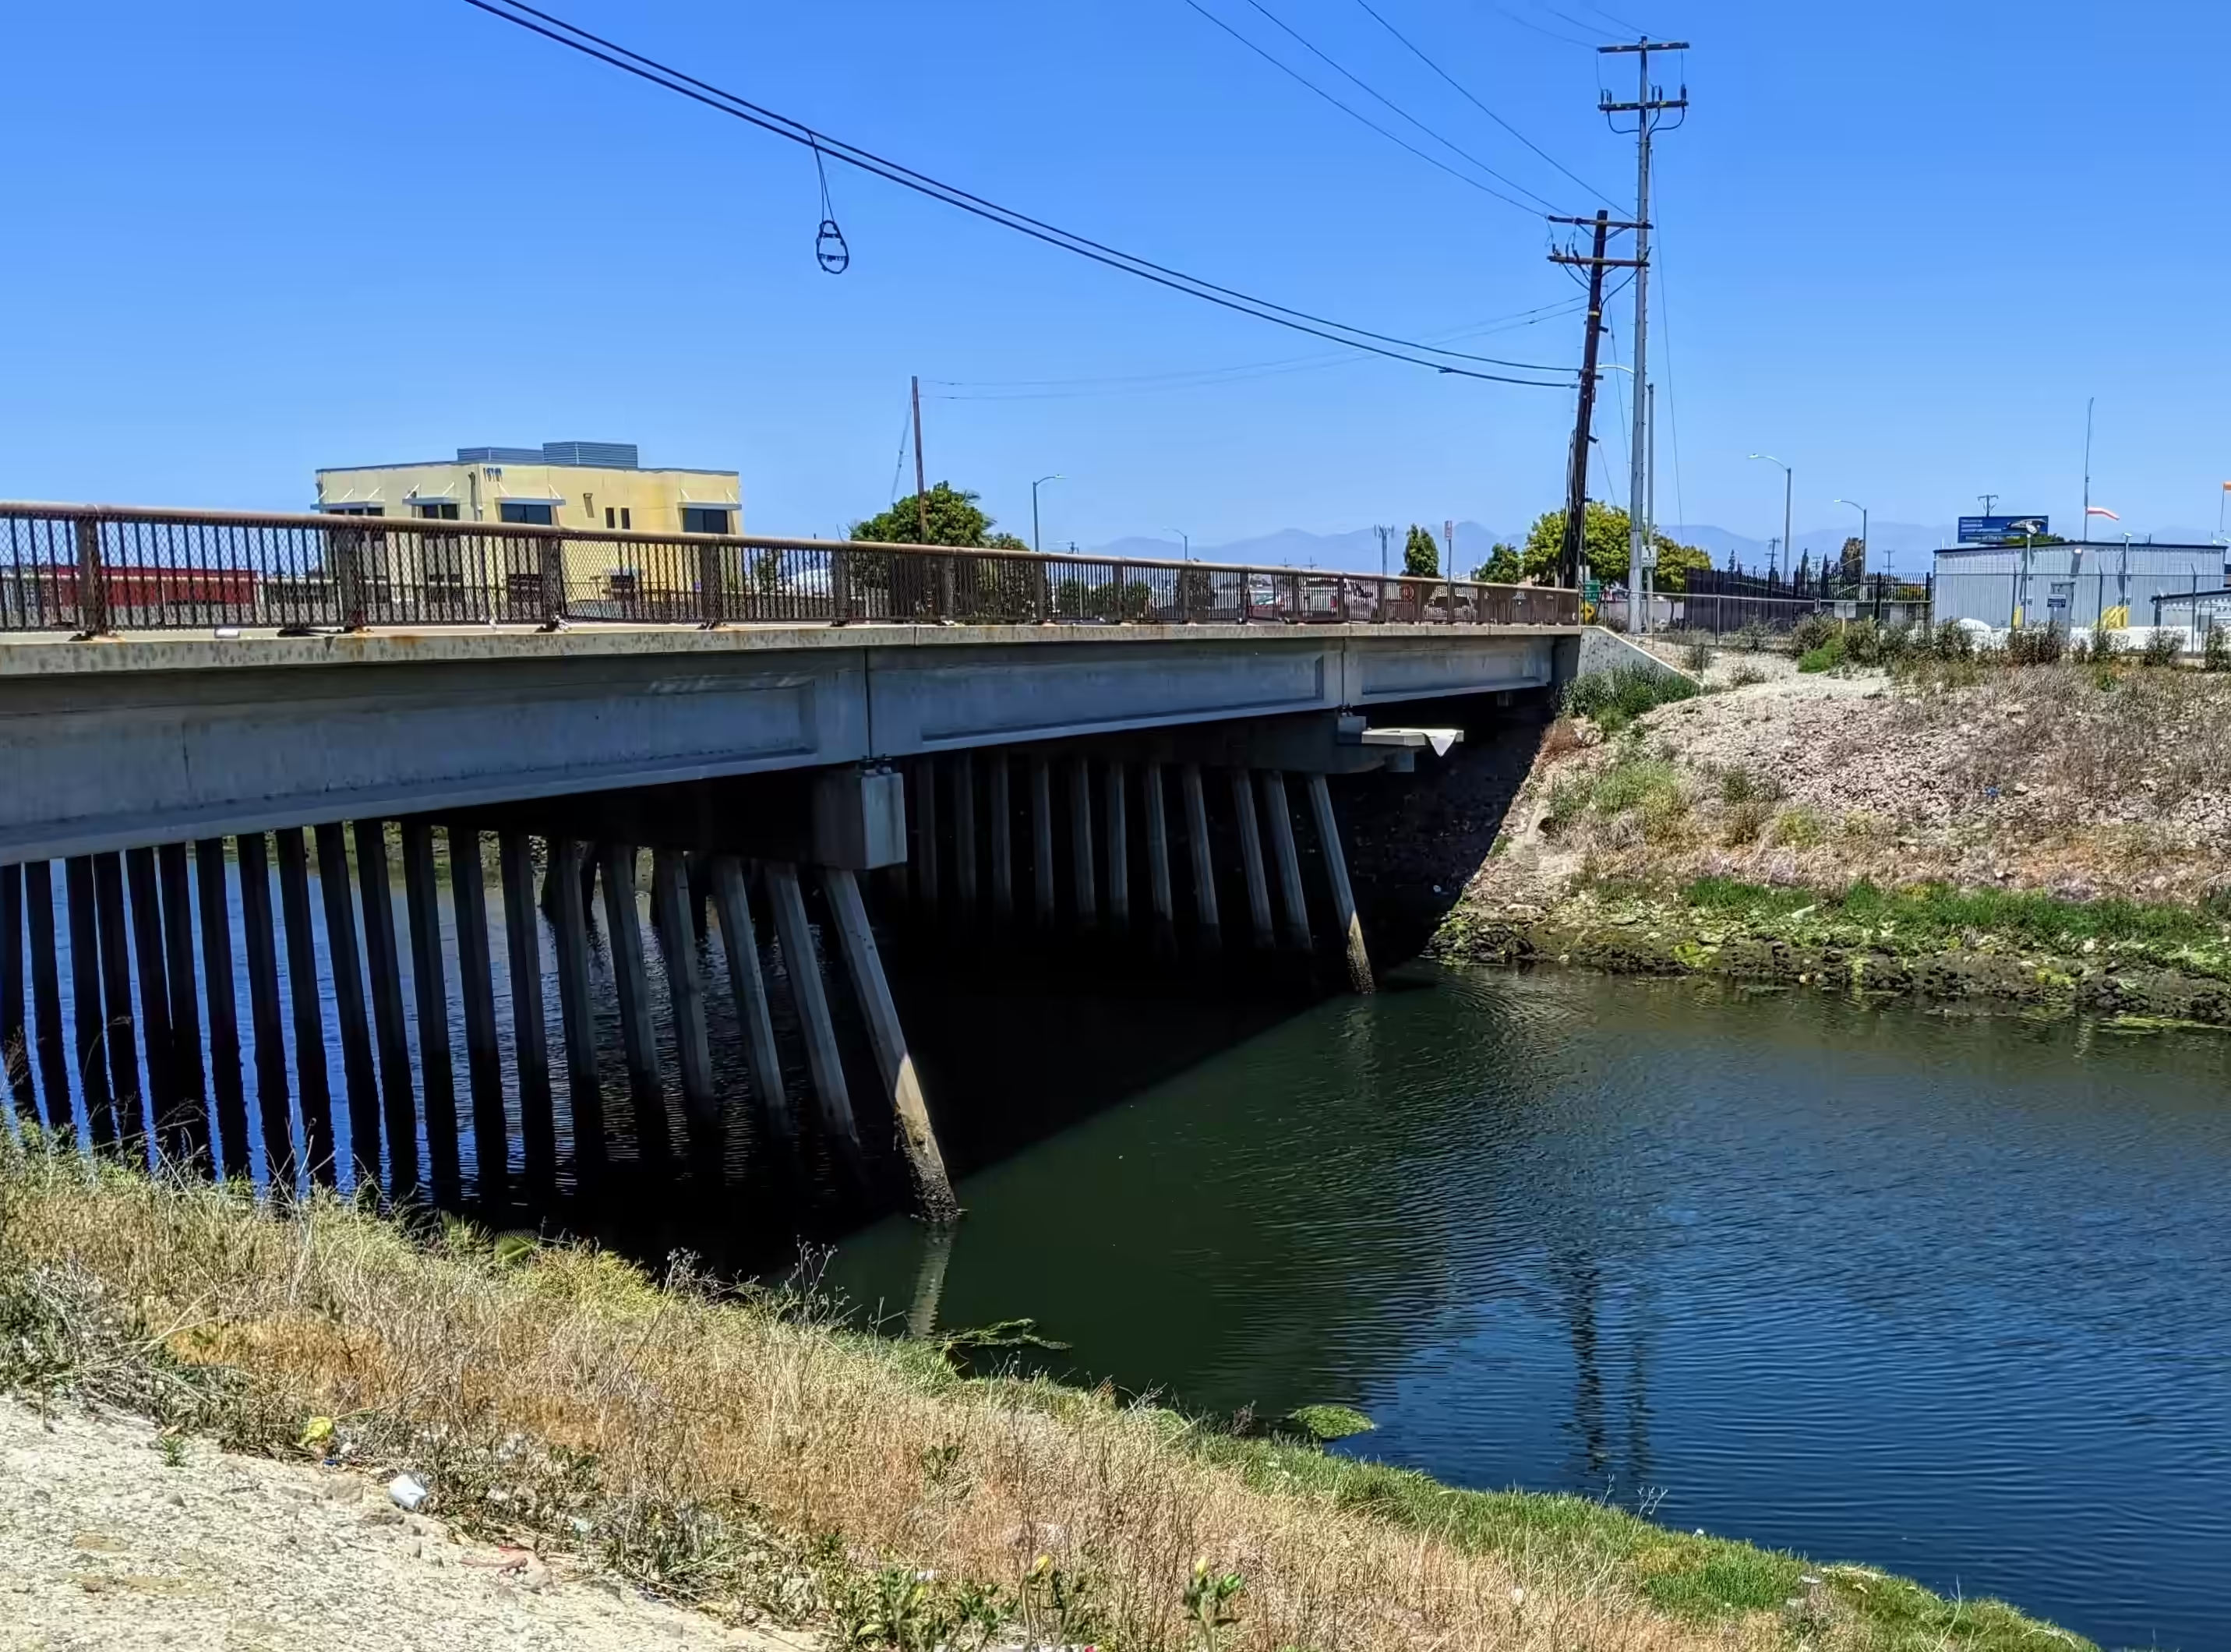
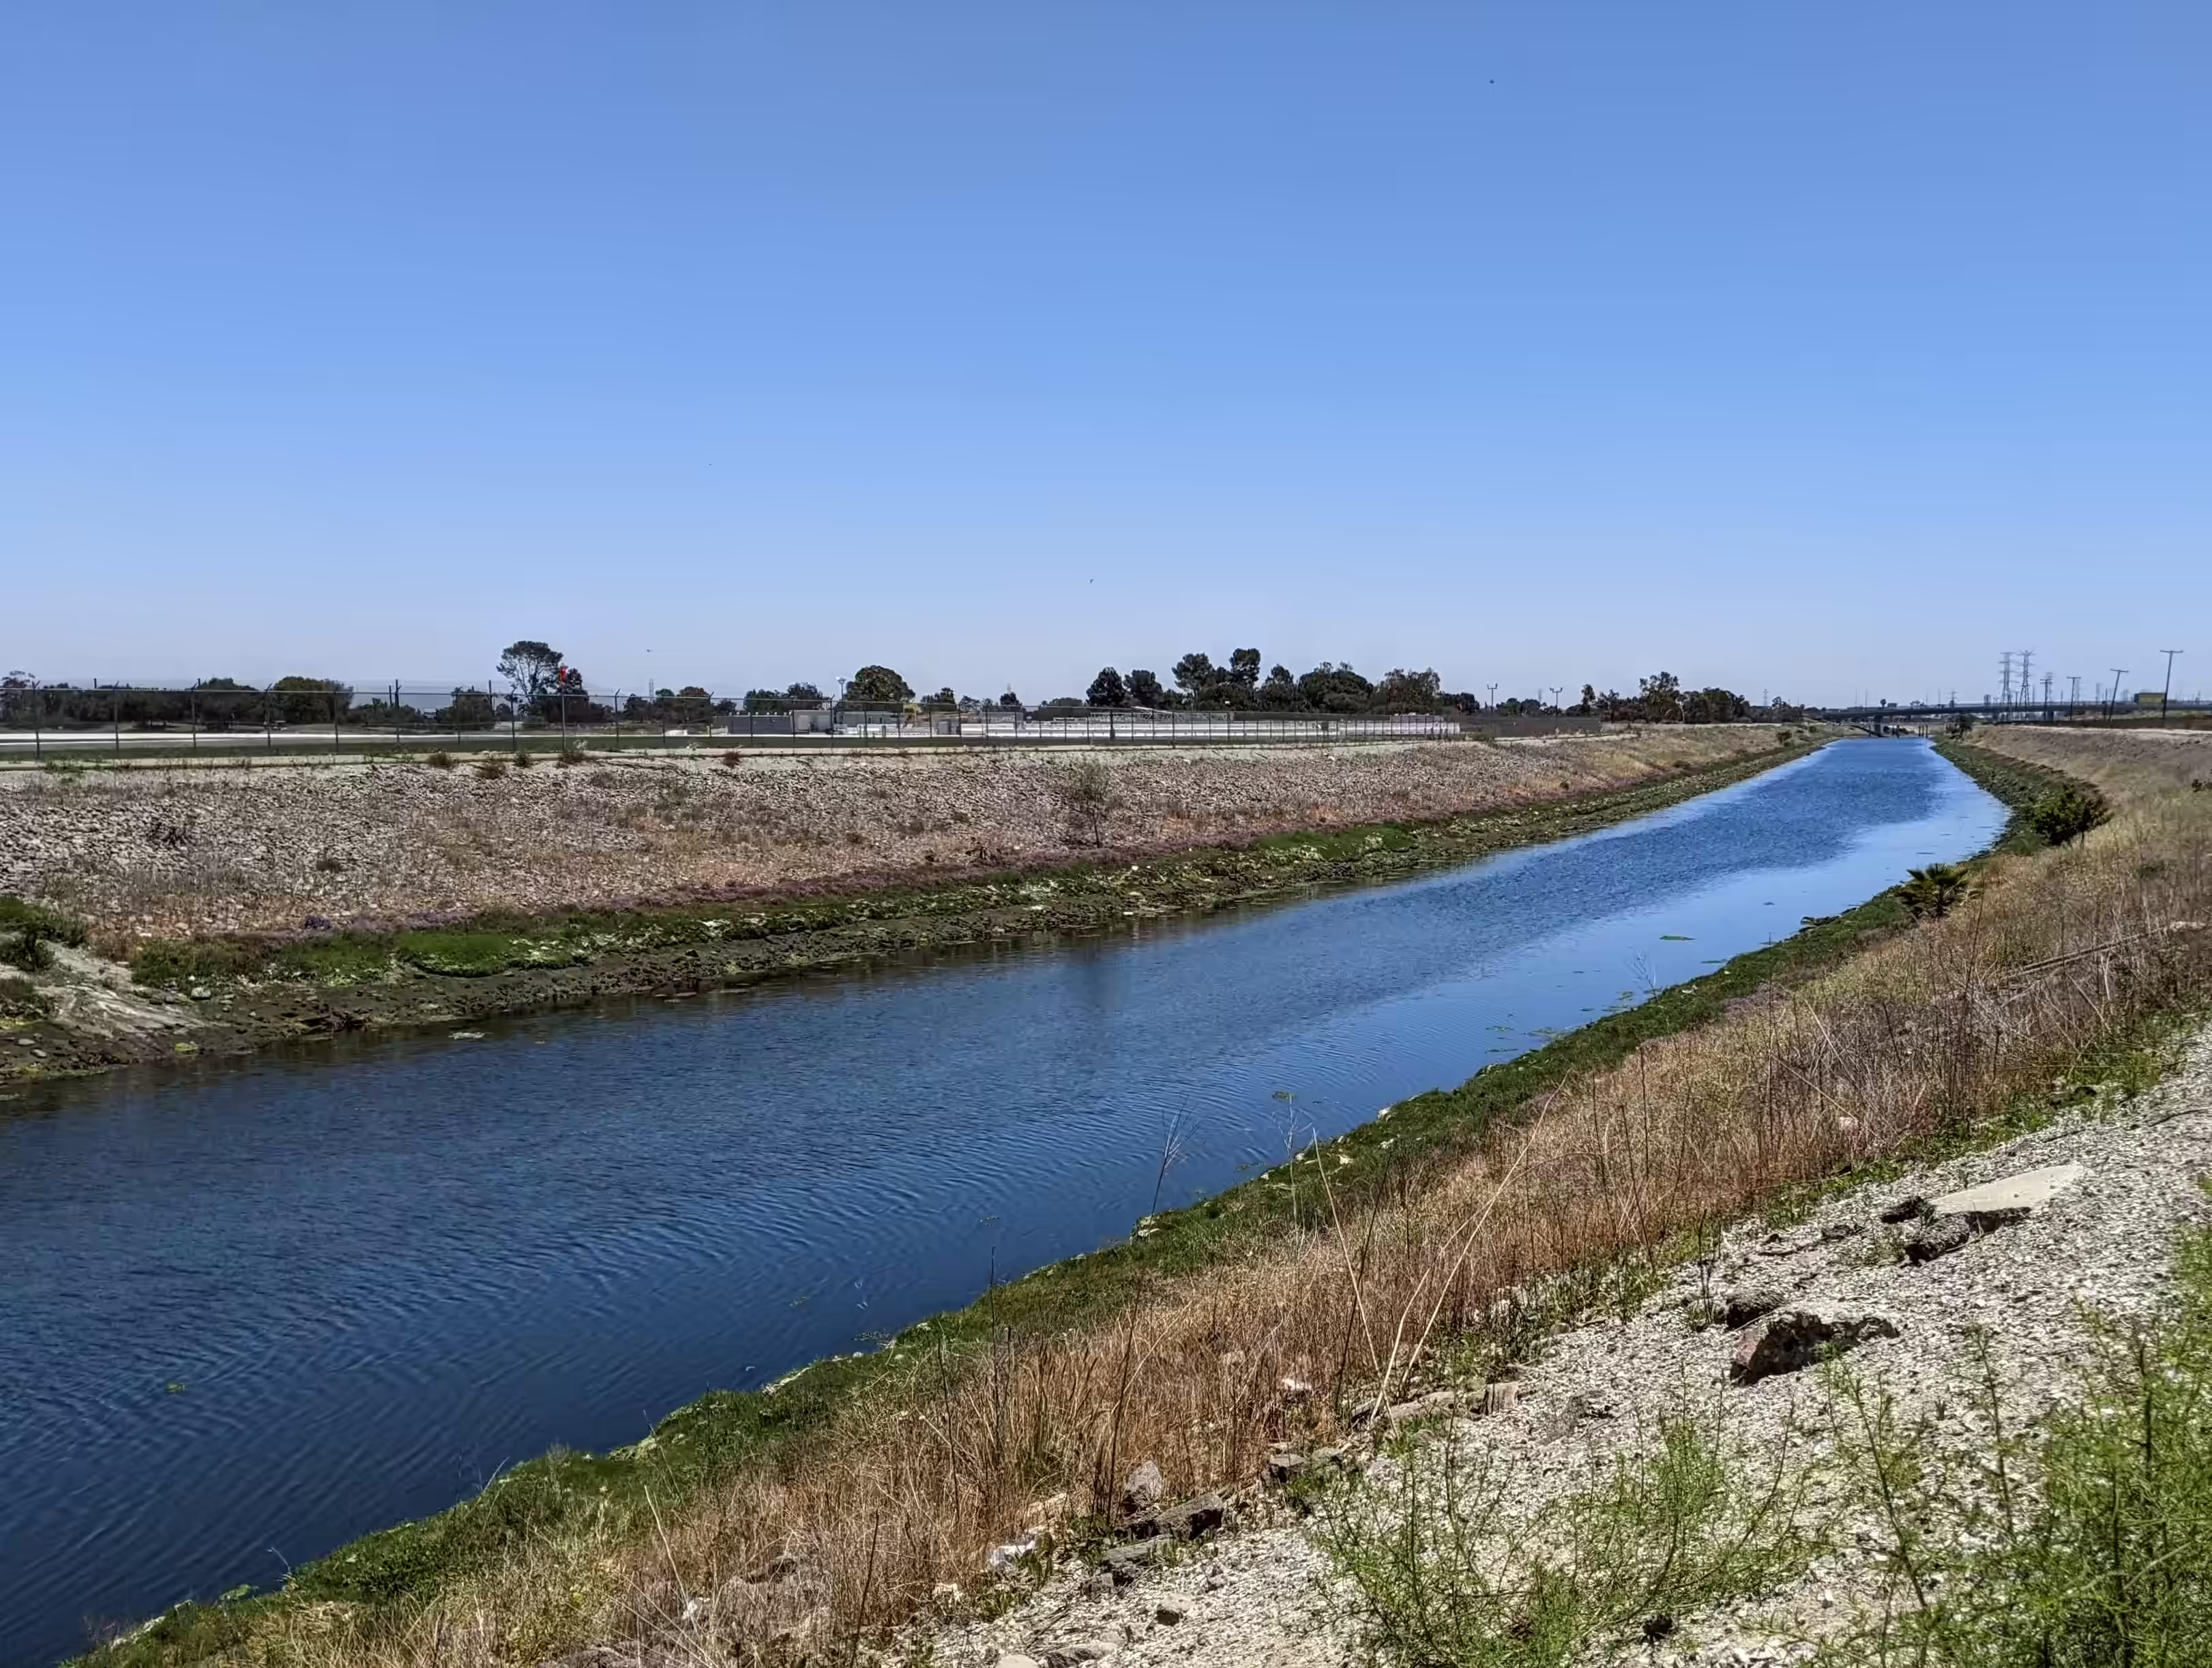
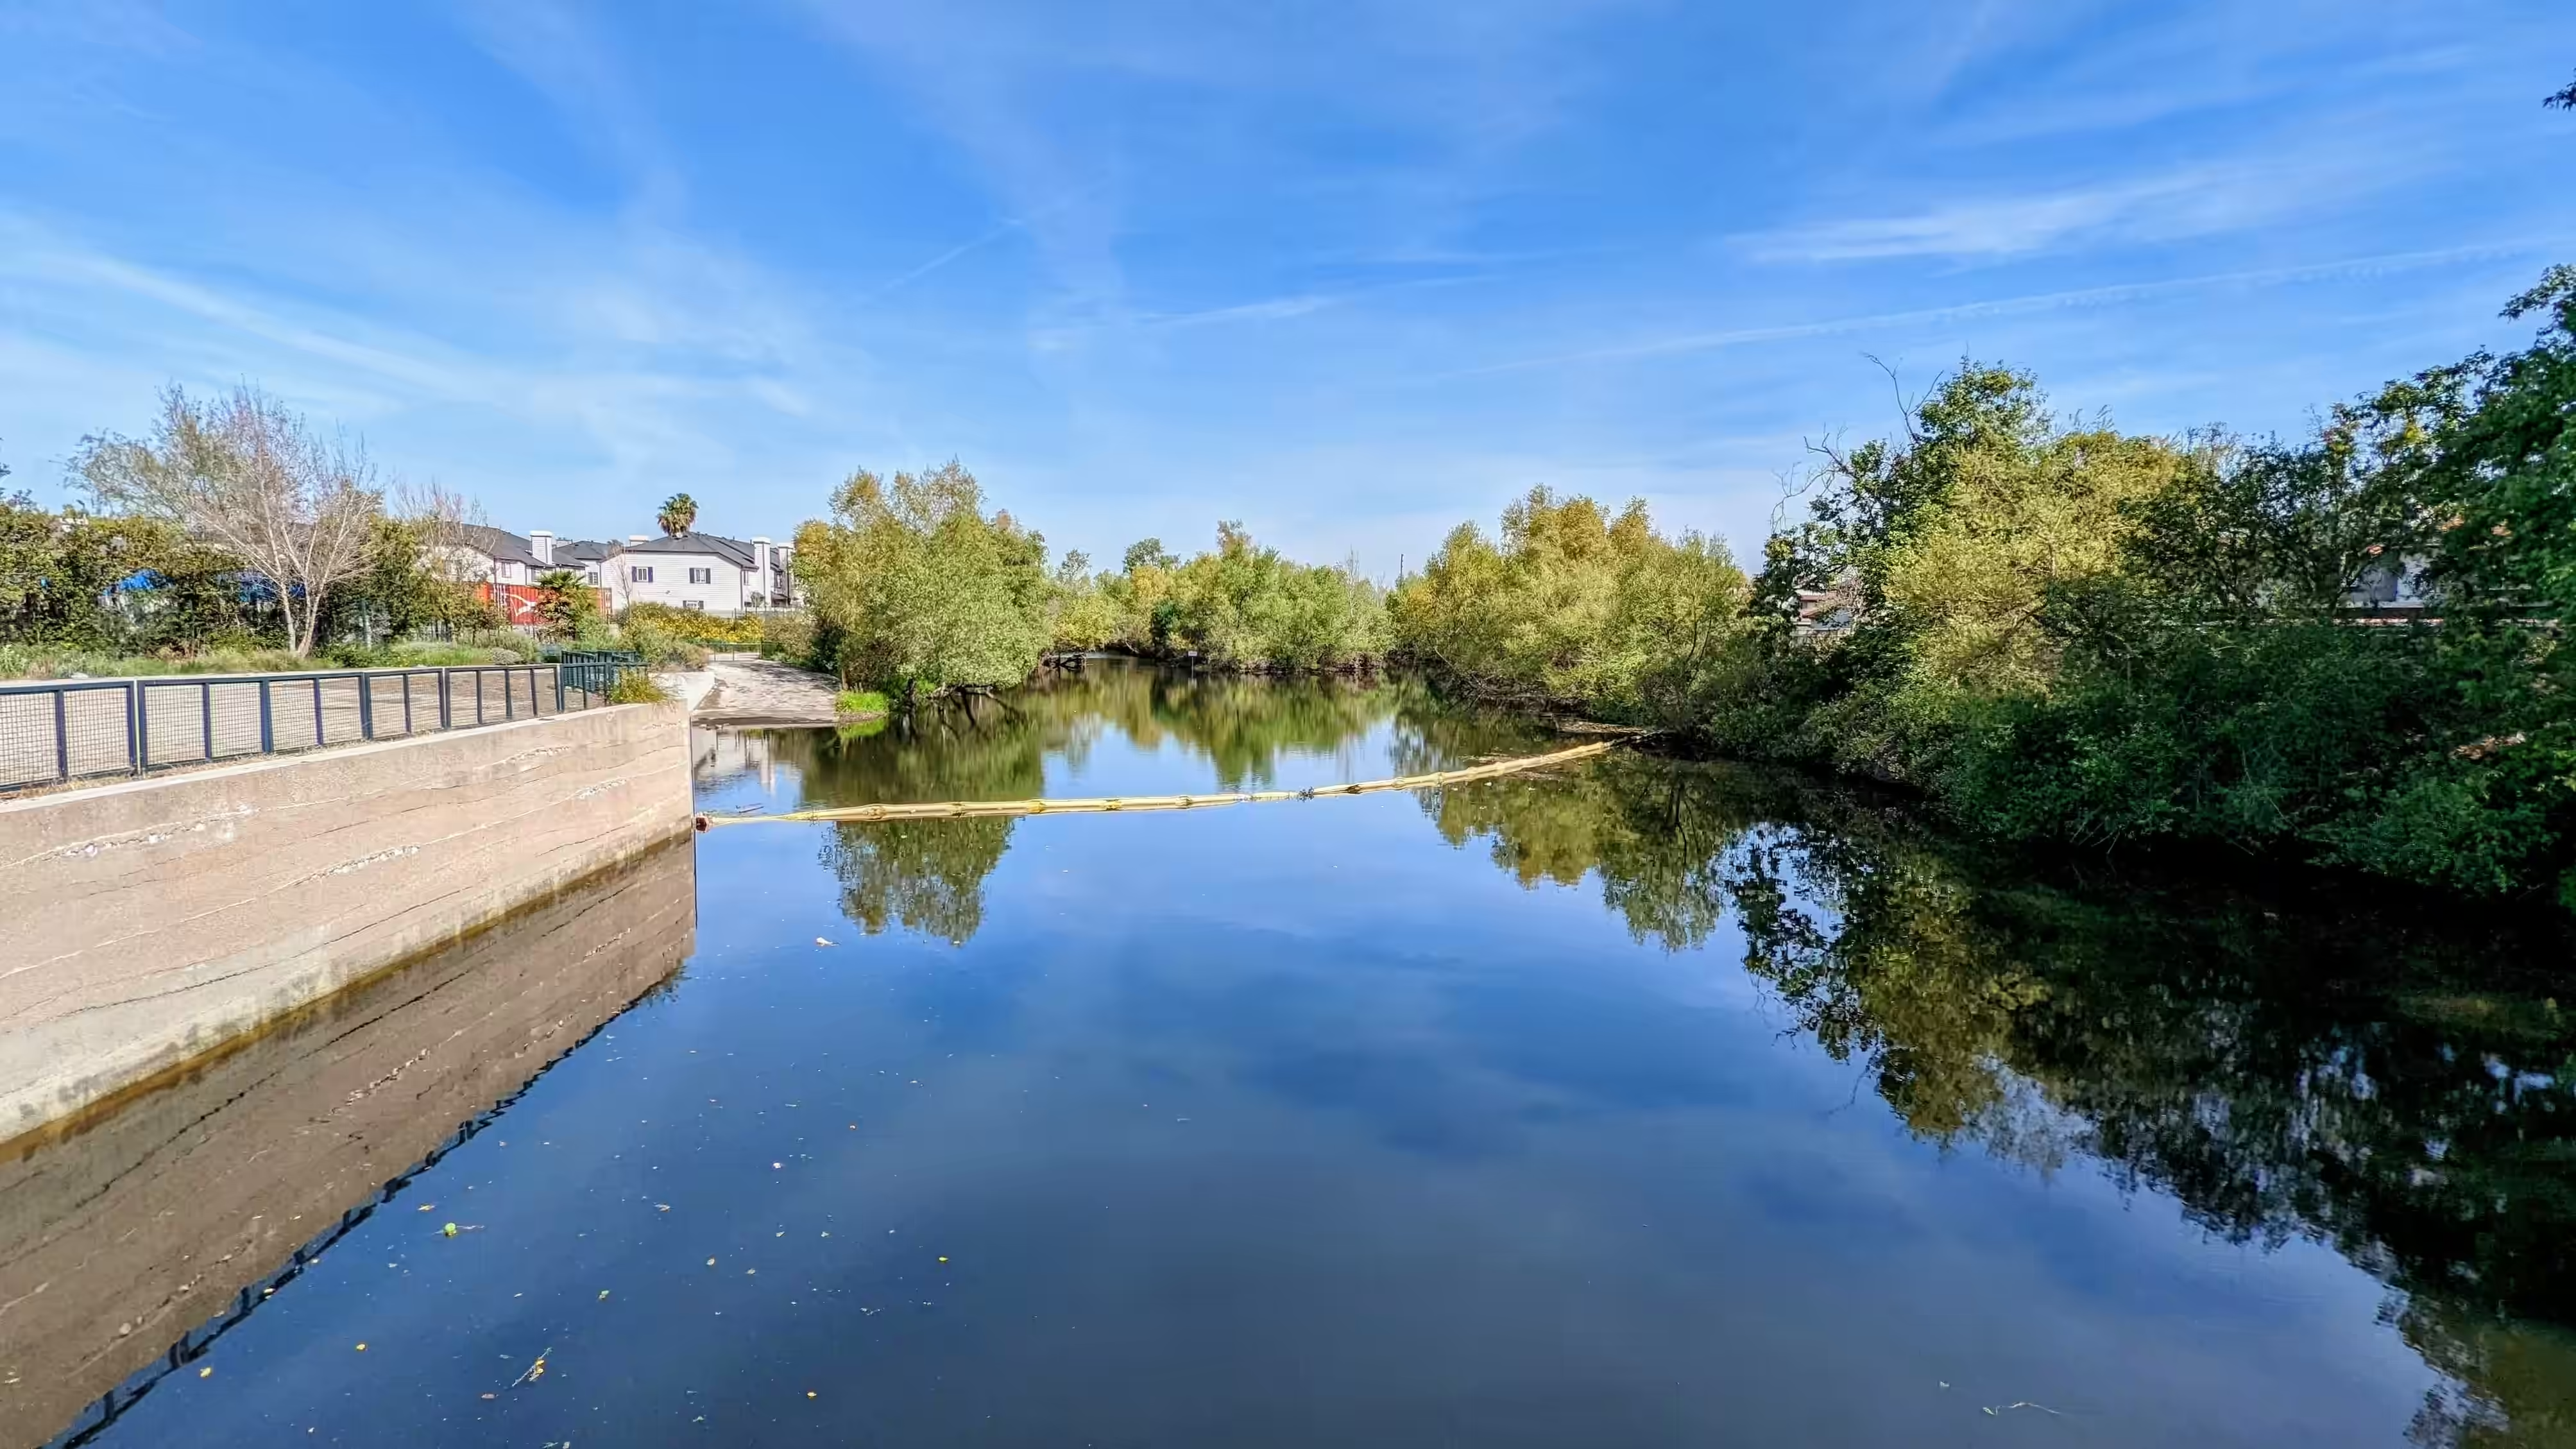
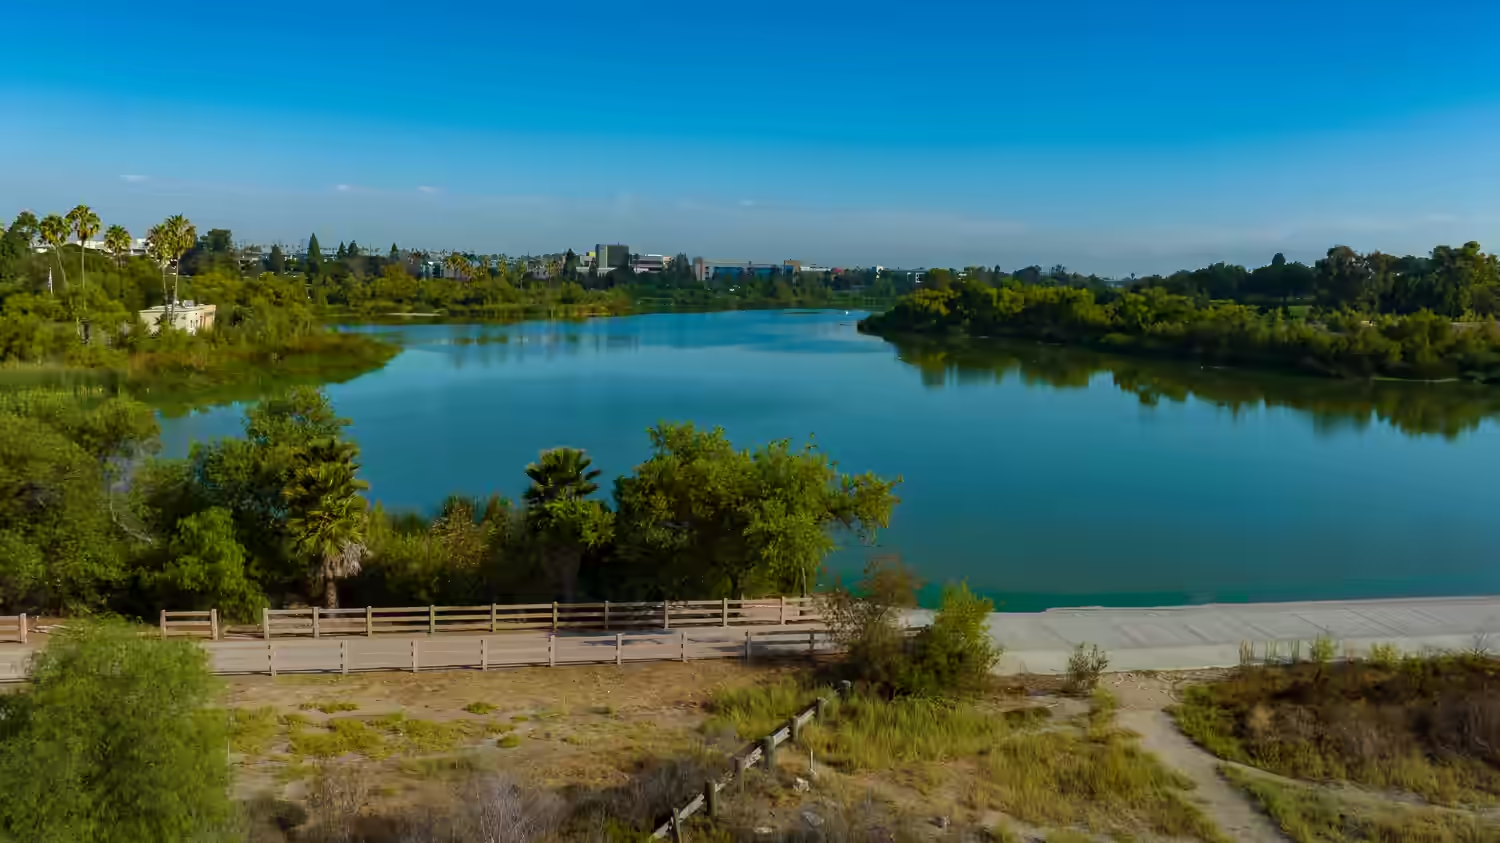
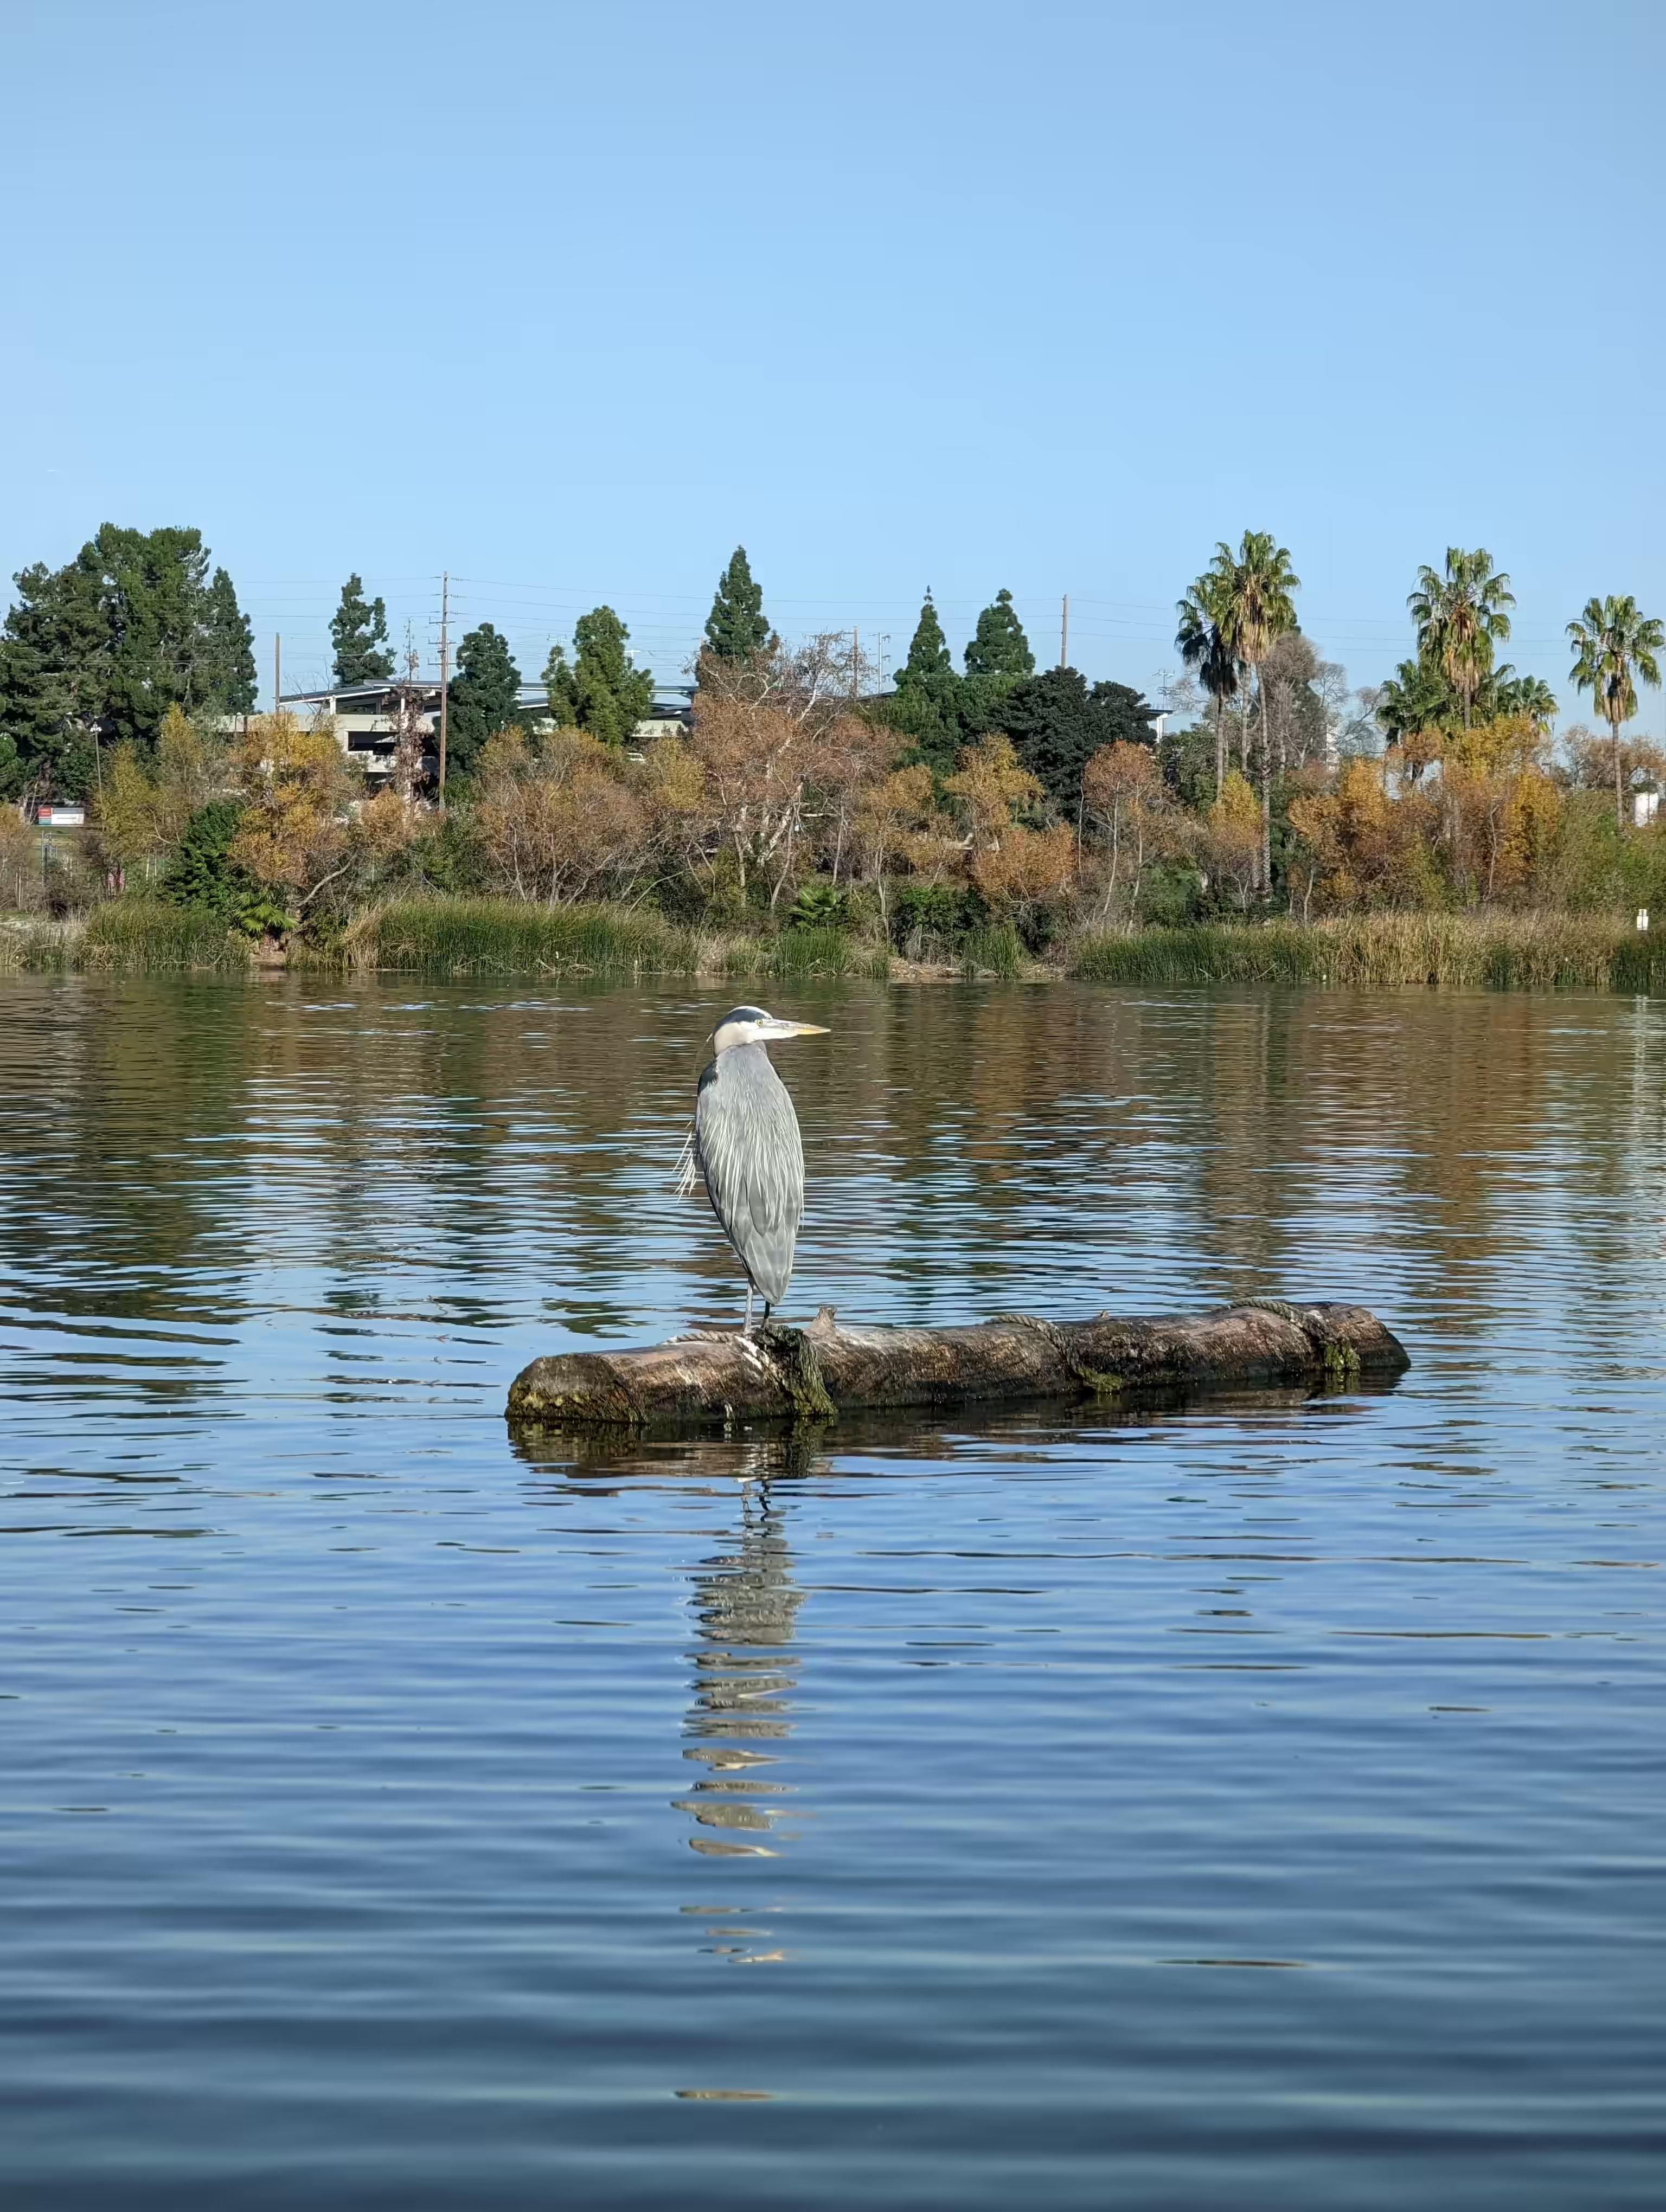
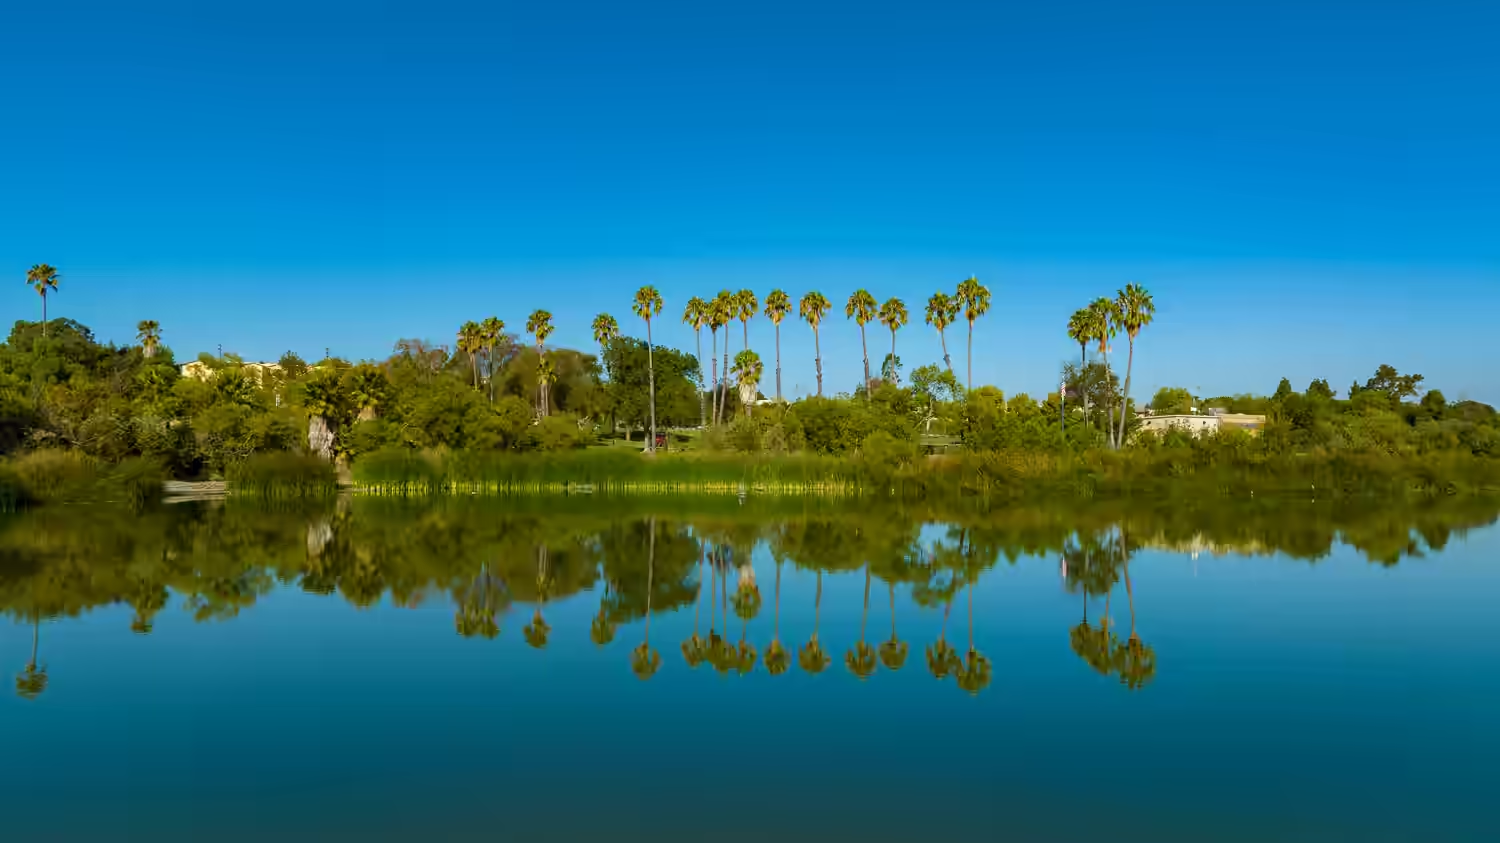
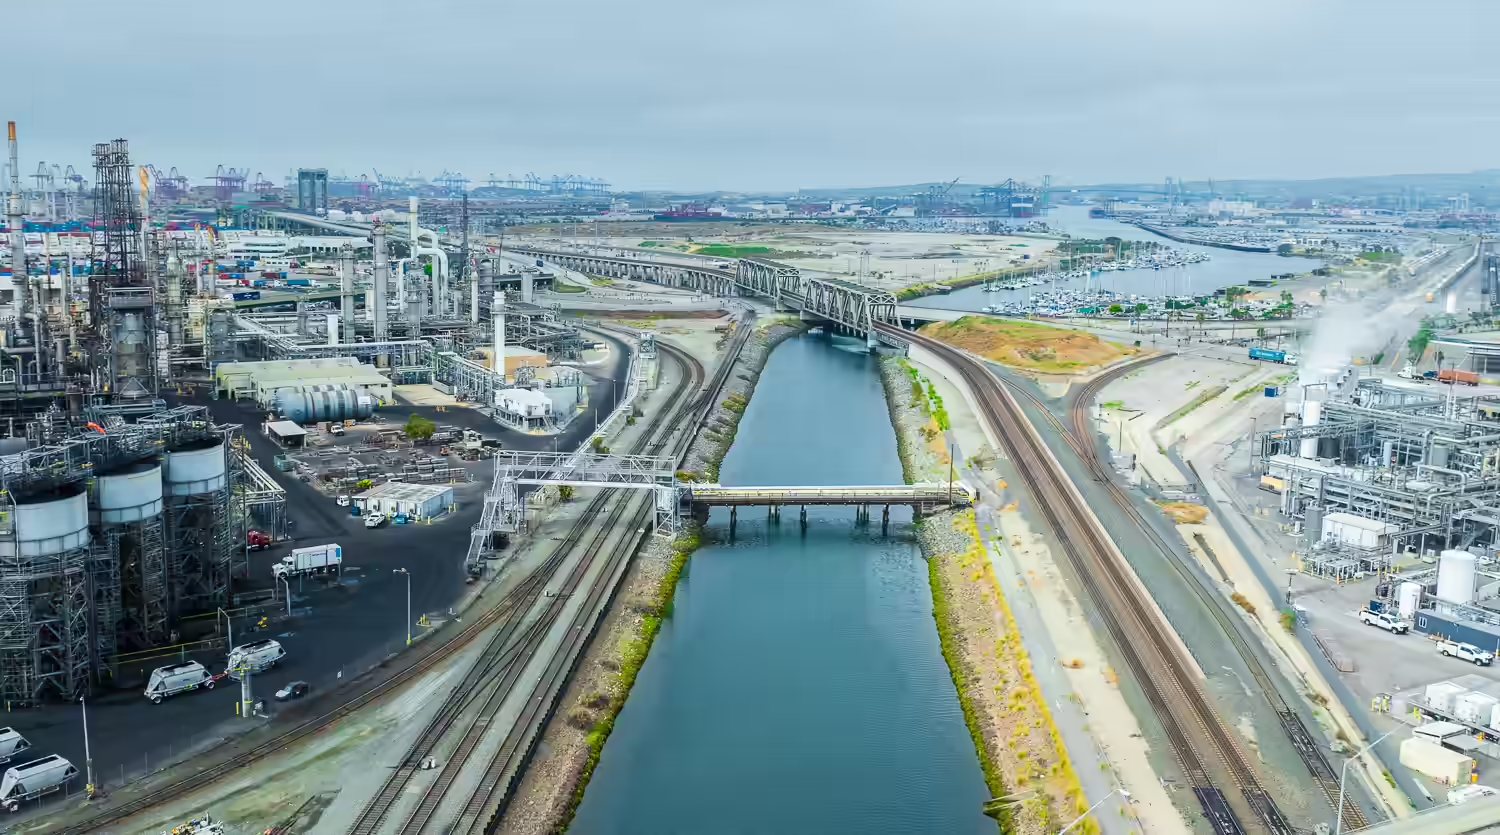
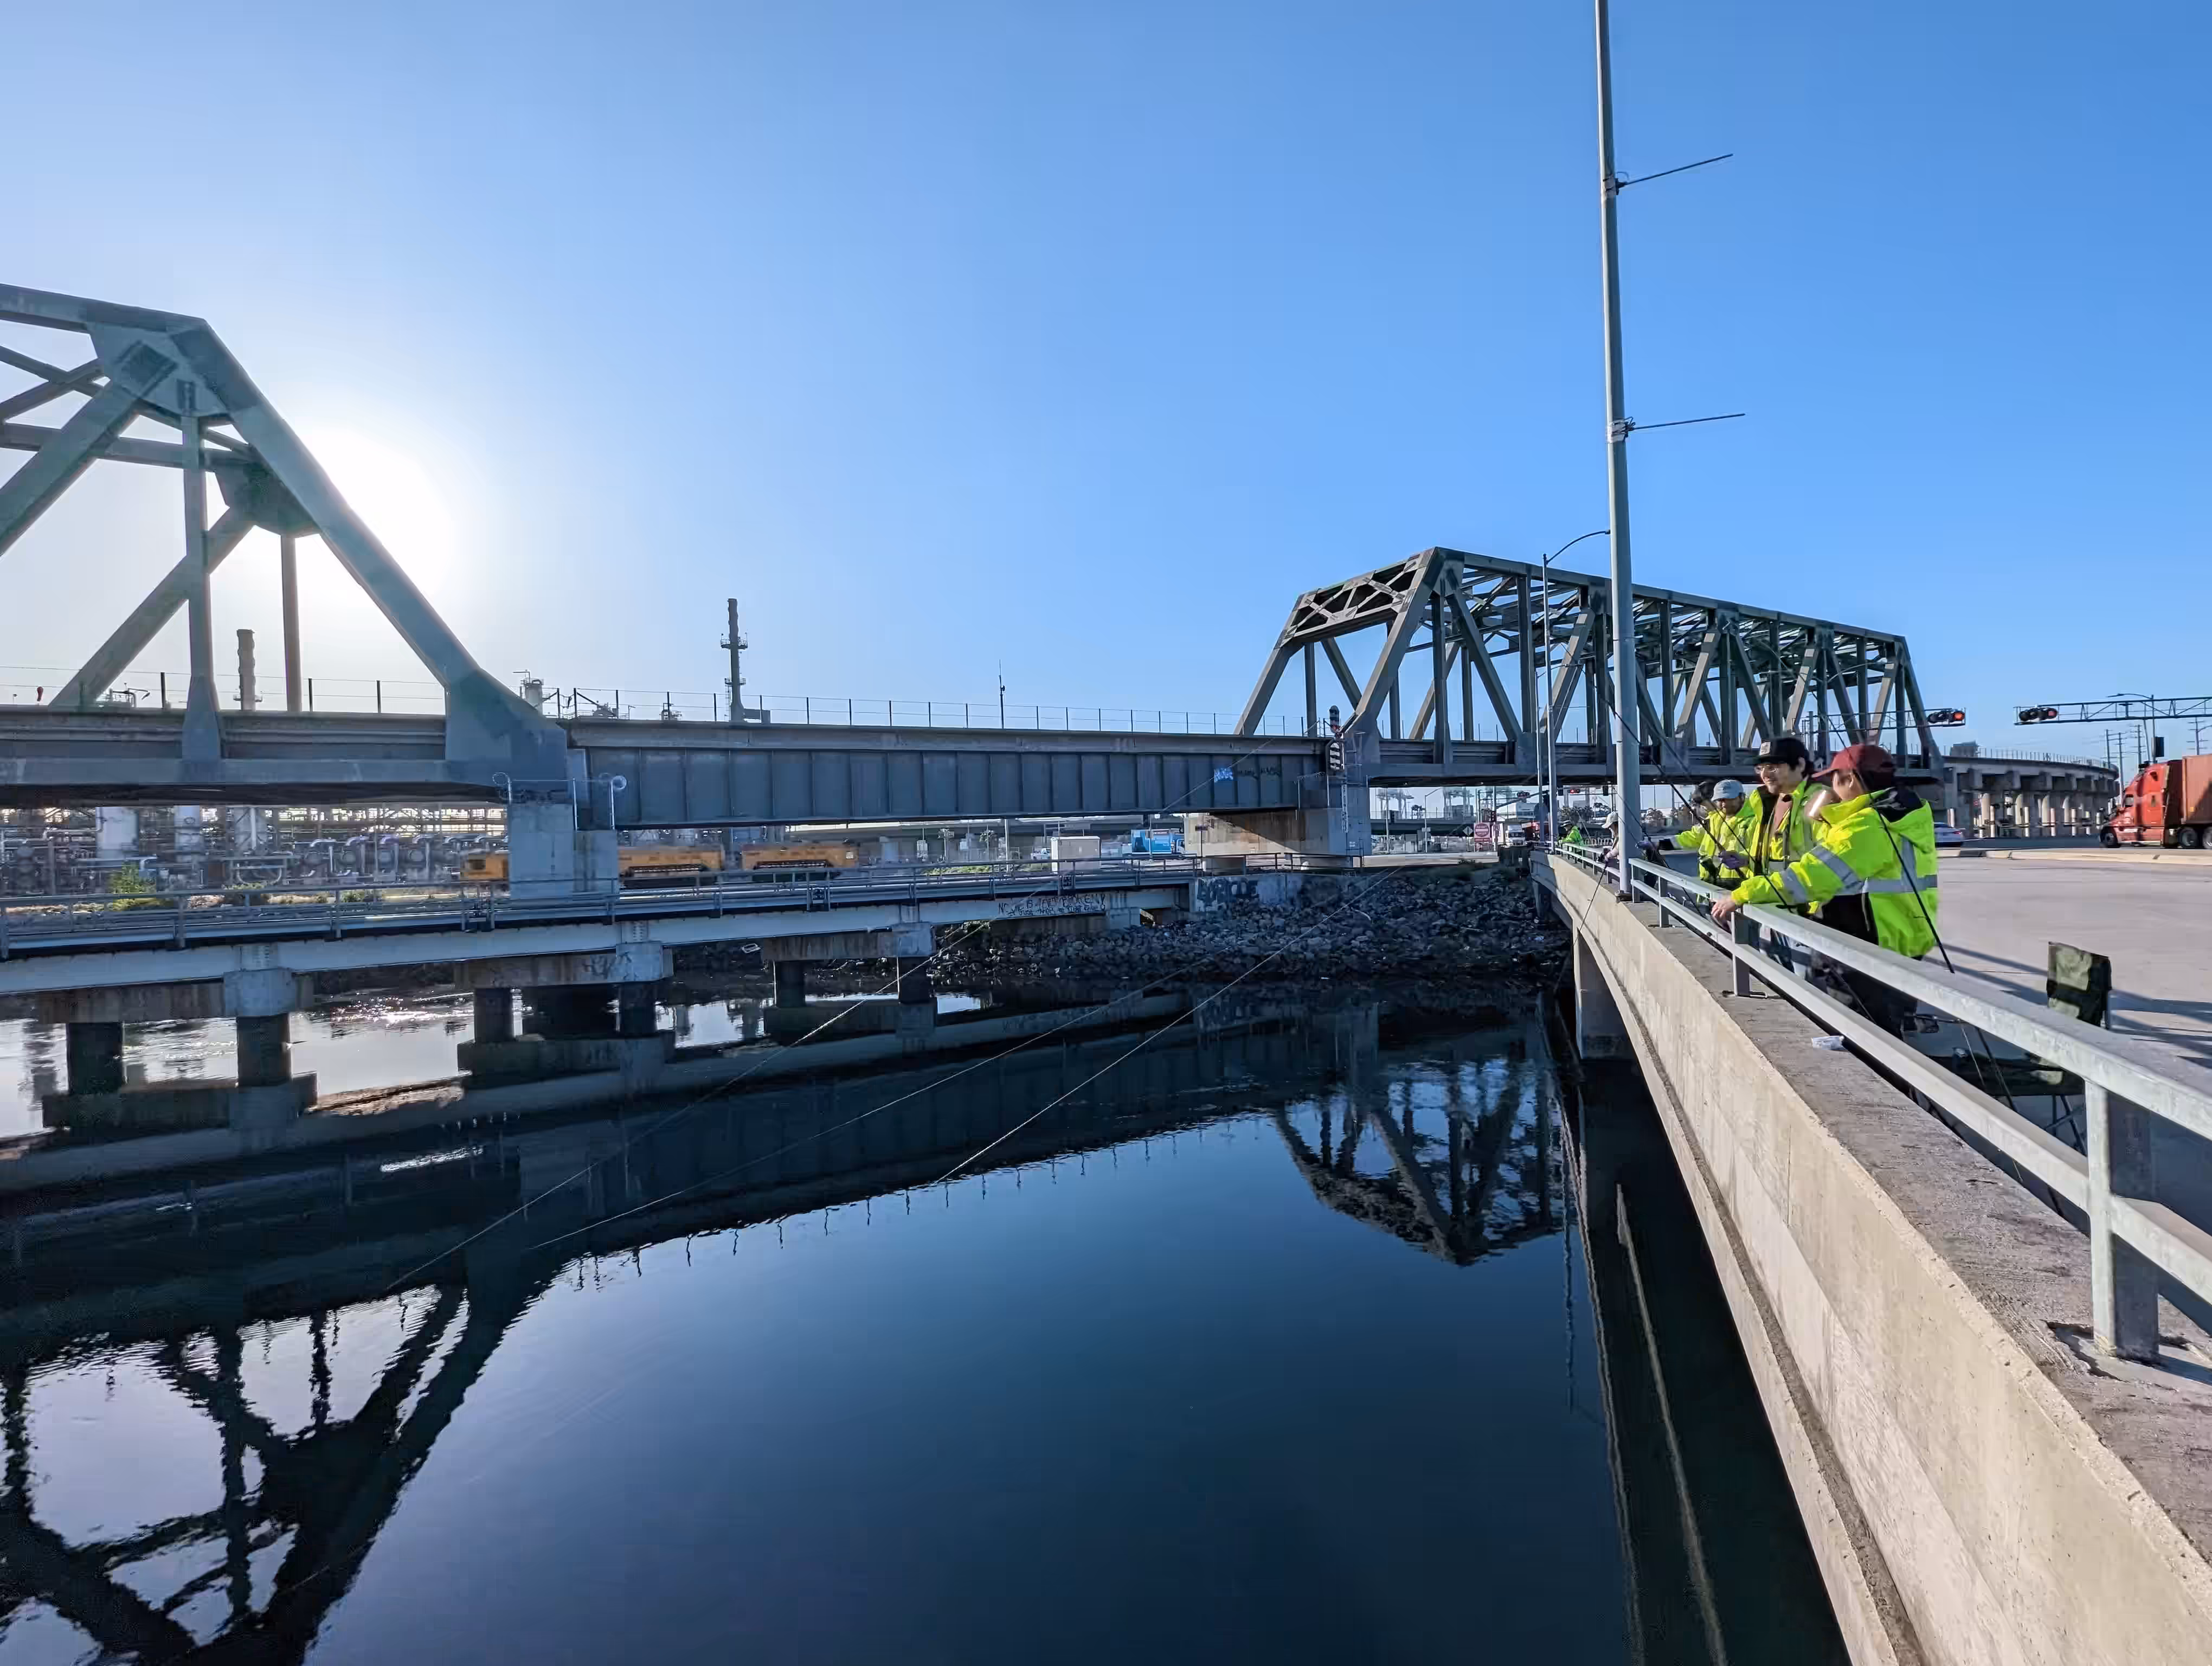
Dominguez Channel Watershed
The portion of the densely populated Dominguez Channel Watershed that is within our Watershed Management Group extends as far north as El Segundo, east to Machado Lake, which is home to over 300 species of migratory birds and other wildlife, and south to the harbor where the channel drains to the ocean. Unless we work hard to clean up the water, the traffic, industrial activities, humans and pets in this watershed can cause the waterways to become polluted.
All 9 member agencies are working together to restore this beautiful watershed for everyone.

Watershed Planning
The smartest projects solve more than one problem.
Our watersheds aren’t perfect. We’ve got a lot of work to do!
From the pollutants coming off cars to the bacteria in the pet waste left on the side of the road, people have a big impact on the pollution entering our waterways.
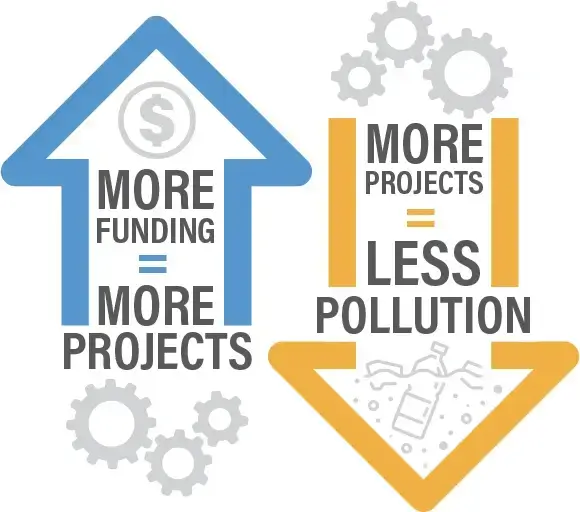
Building better requires funding and careful planning. We are working together to protect our waters in the smartest way possible and maximizing funding opportunities.
We’re implementing projects that improve water quality through nature-based solutions and green infrastructure, while reducing the heat island effect, and providing recreational and neighborhood beautification benefits to the community.
Stumped by the terms? Learn more
Projects and Funding
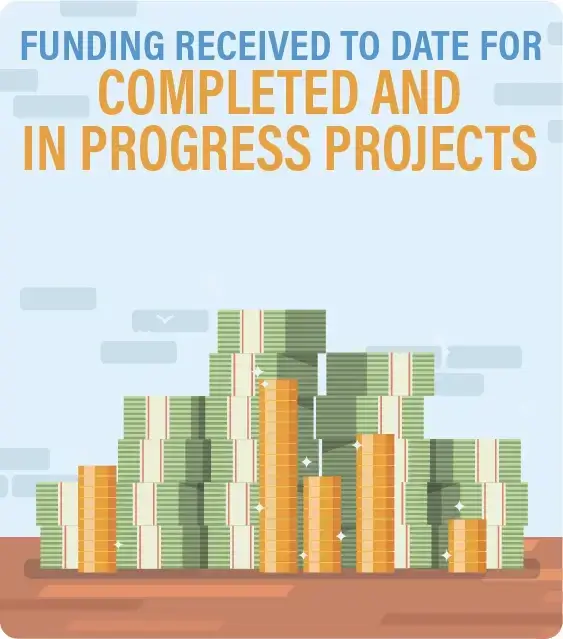
Check out where we are with implementing projects, securing funding, and meeting the needs of the community. We need to capture a lot of stormwater – enough to fill the whole bucket! Some of that bucket will be filled by stormwater that stays on site when homeowners and developers rebuild their properties. Building back in a smart way is called Low Impact Development (LID), and we can estimate how much that’s going to help us over time. More of the stormwater will be captured through the projects we already are working on or already finished. Some of those projects have already received money (yay!), but there’s still a long way to go before we’re done.
Check out how much more money we need to build enough projects to reach our target and clean up our waterways. Stumped by the terms? Learn more
How much stormwater in our watershed do we need to manage?
$304.8 M
| Project Name | Location | Project Type | Status | Capture Volume (acre-ft) | Captial Cost |
|---|---|---|---|---|---|
Alondra Park Multi-Benefit Stormwater Capture Project | Unincorporated LA County, Lawndale, Manhattan Beach, Redondo Beach, El Segundo, Hawthorne | Regional Treatment Facility | Construction | 44 | $ 70,332,000.00 |
Bicentennial Park | Hawthorne | LID Retrofit, Bioretention | Complete | 0.04 | $ 3,000,000.00 |
Calas Park Supplemental Environmental Project | Carson | Other (specify) | Design | 2.9 | $ 0.00 |
Carriage Crest Park | Carson | Diversion to Sanitary Sewer | Post-Construction | 13.5 | $ 22,779,106.00 |
Center Park | Inglewood | LID Retrofit, Bioretention | Complete | 0 | $ 1,000,000.00 |
24
28
29

40
Compliance
How do we know how much we have to do?
Water quality regulations are based on science, which sets limits on how much of a pollutant a river, creek, lake, ocean or other water body can handle and remain safe for people, animals and plants. Different regulations are in effect at different times, and some won't be in effect until a future date. What this means is that compliance (aka, doing what the regulations say needs to be done) is more complicated that just looking at the amount of a pollutant that's in the water body. Here we show how we're doing now, but this can change when new milestone dates come up. To learn more about how much of some pollutants are in our waterways, check out our Water Quality Dashboard page to see the data!
of dry weather receiving water samples achieved WQOs
of wet weather receiving water samples achieved WQOs
of wet weather outfall samples achieved WQOs
of dry weather outfall samples achieved WQOs
Why do so many projects if it’s for a few percentages?
Here we show the percentage of samples collected from July 2024 to June 2025 that meet our water quality objectives (WQOs). These samples were taken from the lakes, rivers, creeks, or the ocean (aka, receiving water), or samples taken from the pipe that discharges to that waterbody (aka, outfall). The samples are compared to what WQOs are in place at the time the sample is taken. Since this will change over time, it's going to take the projects we are building to keep these numbers high so we can achieve compliance in the future.
Learn more about these terms by clicking here or more about our monitoring data by clicking here.
Monitoring
How do we know what we’re doing is working?
We need funding to implement projects, and projects to improve water quality. And how do we know the projects are improving water quality?
We test it.

We have a robust monitoring program in place that involves taking samples of water and sediments at key locations in the watershed and laboratory testing those samples to see what’s in them.